Drone Imagery for ESG and Environmental Baseline Reporting in India
How organisations can use dated aerial evidence for land, water, restoration, construction and environmental reporting without overstating...
By SkyViews Aerial Drone Studio
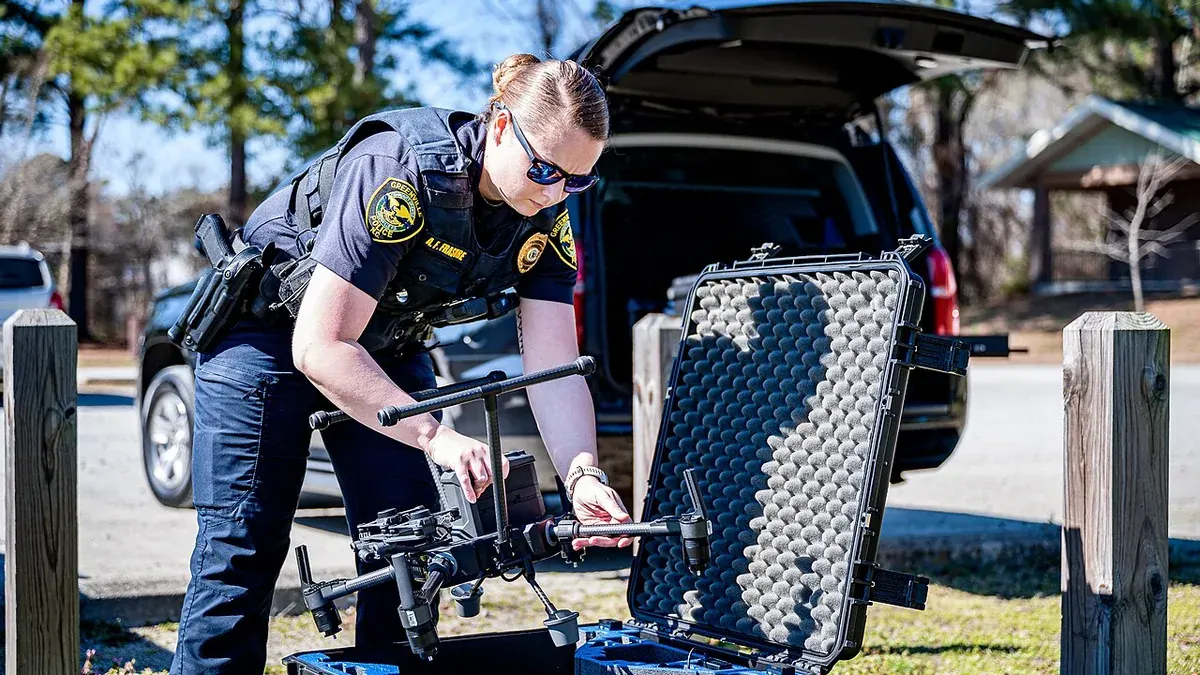
Aerial images can show how a site looks on a stated day. They may record vegetation, surface water, construction disturbance, access roads or a restored area. That makes them useful evidence for environmental management and some sustainability stories. It does not make every green-looking picture an ESG result. The reporting team must define the claim, method and limits before treating imagery as proof.
This guide is for organisations in India planning drone imagery for an environmental baseline or a sustainability report. It explains how to capture a traceable visual record and connect it to field data. It does not interpret a company's reporting obligations. The reporting owner should check the current framework that applies to the organisation. For example, SEBI publishes BRSR material, while GRI explains the principles of accuracy and verifiability. An aerial image is only one possible source within that wider process.
ESG Claim Definition & Baseline Framework
Write the claim before ordering a flight
What does the organisation want to say? “This area was visibly disturbed during construction” is a different claim from “the land has fully recovered.” The first may be supported by dated images and a clear boundary. The second needs an agreed definition of recovery and likely ecological field evidence over time. A flight brief should state the question in plain language and list the other evidence needed.
Choose a limited set of observations the camera can provide. Examples are visible land-cover classes, the extent of a work area, a drainage path, an access track or the location of planting blocks. Avoid adding sensors or products merely because they sound advanced. Start from the decision and then choose the capture method.
Name the person who will review the result. A pilot can deliver photographs and a map. An environmental specialist can interpret ecological meaning. A reporting lead can decide how the evidence fits a disclosure. Those roles should not be blurred in the caption of a public image.
Define a useful baseline
A baseline needs a date, boundary, purpose and known limits. Record where the boundary came from and whether it is surveyed or approximate. Note season, recent weather, visible water, land use and active work. A baseline taken after vegetation clearing cannot stand in for the condition before clearing. If earlier imagery is used, name its source and date.
Give each area a stable ID. A mine-rehabilitation project may use work blocks. A logistics campus may use drainage zones and landscape plots. A watershed project may use reaches or catchment units. The IDs make later comparisons possible and help field teams find the same place.
Keep a coverage map. Mark areas hidden by trees, structures, shadow or flight limits. A seamless-looking mosaic can still contain weak evidence. The report should say where the team needs ground photographs or another source.
Match the product to the question
Standard photographs can show visible conditions and context. A stitched orthomosaic can help locate features across an area. A measured surface model may help with terrain questions when ground control, processing and independent checks are suitable. Multispectral or thermal imagery may answer specific questions only with the right sensor, capture conditions and expert interpretation.
Do not describe a colour map as a measurement without explaining how it was produced. A vegetation index can change with sensor settings, sunlight, soil and season. A thermal difference may reflect time of day or surface material. The client should request the method, calibration information, validation plan and uncertainty when it intends to use such products for a reported figure.
Field sampling remains necessary for many outcomes. An aerial image cannot measure water chemistry, soil contamination or carbon stock by appearance alone. It cannot identify every plant species under a canopy. Use the image to plan where specialists should sample and to show the spatial context of those results.
Source Integrity & Balanced Documentation
Keep the source trail intact
Every published visual claim should point back to a source file or mapped output, capture date, area ID and method note. Preserve original images separately from cropped, annotated or colour-graded versions. Record who made a classification, what classes were used and whether field samples checked it. A reviewer should be able to retrace the result without guessing how a slide was assembled.
Use consistent filenames and a simple index. If a report shows “vegetation increased in Zone 3,” the team should be able to find both dates' maps, the boundary used for Zone 3 and the method for comparing them. If the boundary or method changed, explain that change before presenting a percentage.
Do not erase uncertainty to make a chart tidy. A block partly hidden by cloud, canopy or standing water may need to be excluded or shown as uncertain. An honest limitation is better than a precise-looking number without support.
Compare like conditions where possible
An area photographed after rain can look greener than it did in the dry season. Water levels, shadows, planting cycles and temporary work also affect the scene. Repeat captures at comparable seasons or stages when the project needs a trend. Record differences that cannot be controlled.
Use the same area IDs and a documented processing approach. Pair current and earlier views with dates. State the visible change first, then the possible explanation, then the field check needed. “More open water is visible in the northern basin” is an observation. “Restoration improved water quality” is a different claim requiring other evidence.
If the project changed its sensor or map method, avoid stitching the two results into one smooth trend without a bridge study. A reporting team should know whether a change reflects the site or the measurement process.
Include what did not improve
Environmental reporting should not show only the most attractive area. A new tree belt may be visible beside a disturbed soil zone. A lake edge may look cleaner while an inlet remains blocked. Define the full reporting boundary and include material exceptions. A balanced visual record lets the owner plan work and gives readers a fair picture.
The GRI reporting principles include balance, clarity, comparability and verifiability. Even when an organisation does not use GRI, these are useful questions for a visual evidence pack: Is the selection representative? Can another person check it? Are dates and methods comparable? Are important gaps visible?
Do not use a single site photograph to claim organisation-wide performance. The image has a location and time. A corporate claim may cover many sites, years and data sources. The reporting lead should decide whether the image illustrates a broader claim or actually supports a specific local statement.
Protect people and sensitive locations
Environmental sites may include homes, workers, community routes or sensitive habitat. Plan the capture with the site authority and local partners. Choose viewpoints that answer the reporting question without collecting unnecessary private detail. Decide who can access full-resolution imagery and what belongs in a public report.
A map of restoration work may reveal rare species locations or vulnerable access points. Review labels and metadata before publication. A public version can show broad progress while the operational team keeps detailed coordinates under suitable controls. Community context should be checked with the people who know and use the land; a high camera can make inhabited space look empty.
Evidence Packaging & Construction Case
Build a small evidence pack
A practical pack can contain a boundary map, dated original images, an image index, processed outputs, method notes, field-data links, comparison views and a limitations log. Add a short statement about what the imagery shows and what it cannot establish. The reporting owner can then decide what wording is justified in an ESG or environmental document.
If a figure is calculated, include units, area, exclusions, quality checks and the person who reviewed it. If a claim is qualitative, make the description specific enough to check. “Visible vegetation cover expanded in the mapped eastern plot between two stated dates” is more defensible than “we restored the ecosystem” when only images are available.
Example: a construction-landscape baseline
Consider a company developing a large campus. Before work, it captures the site and marks drainage, existing trees and disturbed ground. During construction, it records the work area. After planting, it repeats the map and photographs. A field team checks which planted species survived and samples water where needed. The final report can show visible land-cover change with dates and field evidence. It does not turn an attractive after-image into a carbon or biodiversity claim without the method to support it.
The best aerial contribution to ESG reporting is a clear, retraceable view of a defined place. It helps people see where to investigate and what changed. For related monitoring, see the forest-restoration guide and floodplain mapping guide.
Plan your project
Share your site, dates and intended output so we can confirm a suitable scope.
Environmental & ESG Monitoring · Compare project scope · Get in touch
Related reading
- Coastal Erosion and Environmental Drone Monitoring in India
- Floodplain Drone Mapping and Water-Risk Documentation in India
- Heritage and Monument Drone Photography in India: Documentation Guide
- Commercial Drone Shoot Call Sheet: What to Include Before Crew Arrival
- Drone Asset Inventory Data Model: From Aerial Images to Actionable Records
- Drone Project Closeout and Handover Checklist for Indian Clients
Contact SkyViews Aerial Drone Studio at +91 90190 56479 or skyviewsdronestudio@gmail.com. Service area: Bangalore, Karnataka and India and wider Bangalore, Karnataka and India.